San Francisco New Development Report
San Francisco New Construction & Development:Residential & Commercial Projects
Highlights from the Q3 2014 Pipeline Report by the SF Planning Department
On December 19th, the San Francisco Planning Department issued its excellent Q3 2014 Pipeline Report, which tracks new residential and commercial development in the city. There is a wealth of data within its 36 pages: Below are some highlights we found most interesting.
The Pipeline includes projects in every stage of the approvals, permits and construction process, and being listed in the pipeline doesn’t indicate when or even if the project will be completed. Changes and additions to the pipeline occur on an ongoing basis: Indeed, it seems rarely a day goes by nowadays without a big new project being announced. Last but not least, changes in economic and political circumstances can suddenly and dramatically impact new development plans and construction: This industry is classically subject to huge boom and bust cycles.
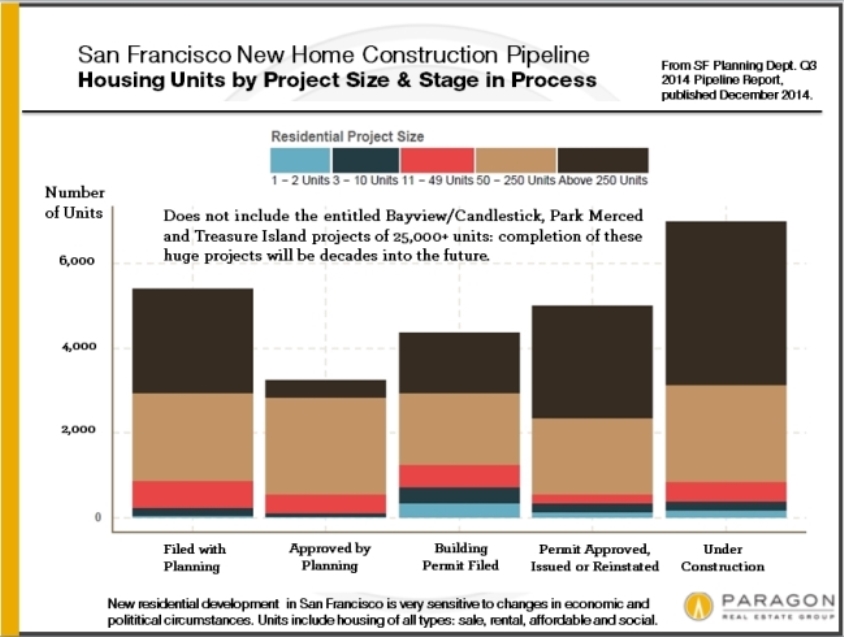
- 50,600 residential units are in the current pipeline, including condos, houses and apartments, as well as affordable and social-project housing. Houses constitute far less than 1% of the total units. (There are currently approximately 381,000 housing units in San Francisco, per 2013 U.S. Census data.)
- 18,700,000 square feet of commercial space are in the pipeline, including office, retail, medical, hotel, cultural, institutional and educational uses. 12 million of the square footage in the pipeline are for office use. (As of 2013, there were approximately 75.6 million square feet of office space in the city.)
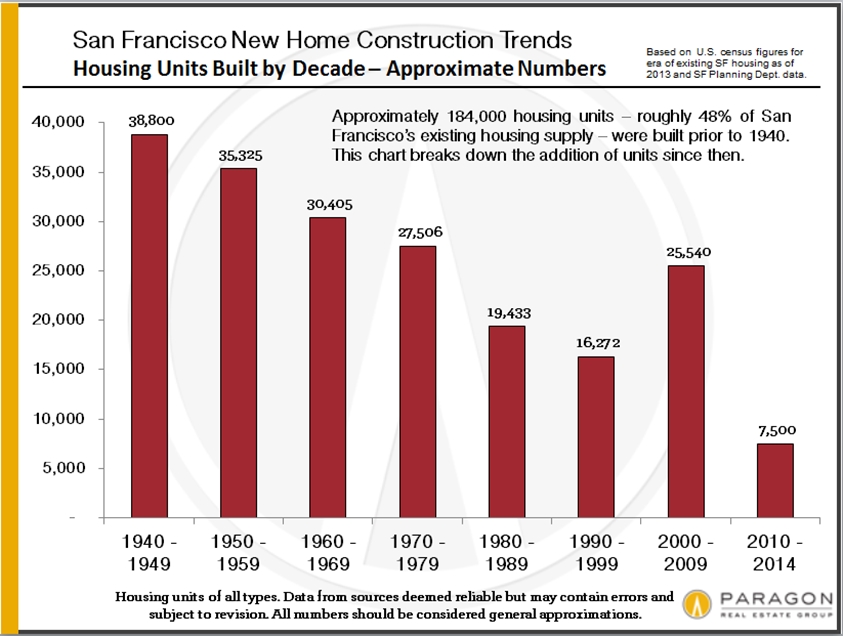
- 3090 residential units and 280,000 square feet of commercial space have been added in the past 4 quarters. “The median time to completion for these projects from the first filing was 43 months.” For smaller projects of less than 10,000 square feet, the median time dropped to 30 months. Since 2000, approximately 27,000 housing units of all kinds have been added in San Francisco. And tying new home construction to employment and the real estate market, Socketsite put it succinctly (1/2015): "Around 7,500 units of housing have been built in San Francisco since January 1, 2010. Over the same five years, the number of employed residents has increased by 74,000. And in a nutshell, that ten-to-one ratio has been driving the trend in rents and property values." We believe there are other forces also at play - see our 10 Factors behind the Market article - but this is a big one. How the surge in new construction will affect the market will depend on what type of inventory is added, and whether current trends in population and employment continue.
- 6700 new residential units and 5,400,000 square feet of commercial space are currently under construction. It is estimated that of the 3 million square feet of office space under construction, half has already been pre-leased for the expansion of a handful of the city's largest high-tech firms.
- Approximately 25,800 of the pipeline’s residential units are comprised of the Bayview/Hunter’s Point/Candlestick, Park Merced and Treasure Island projects.“Full realization of the projects will be decades into the future.” The Bayview/Candlestick and Treasure Island developments are situated on parcels designated as “Public Land.”
- Not counting the 3 big projects mentioned above, the great majority of both residential and commercial pipeline projects are currently clustered in the greater South Beach/South of Market/Mission Bay area, the Market Street corridor, the Potrero Hill/Dogpatch area, and the Mission.
- Approximately 800,000 square feet of manufacturing, distribution and repair use space would be lost in the course of existing pipeline development, to be replaced by housing or other commercial uses.
The full Planning Department Pipeline Report can be downloaded here. There’s also a nifty interactive map illustrating projects in the pipeline. Our sincere gratitude to Aksel Olsen and Teresa Ojeda of the SF Planning Department for compiling this useful and comprehensive report.
The first chart comes directly from the Planning Department Pipeline Report. There is a district-breakdown chart to reflect more common neighborhood and district names. New-home construction volume in San Francisco by decade is provided for historical context. Finally at the end is a snapshot of the Planning Department map to give an idea of the current number of development projects in the city.
Residential Construction
This chart below is not from the pipeline report, but we created it to give more historical context to the subject. 49% of San Francisco’s housing stock was built prior to 1940. As illustrated below, the surge in population during WW II led to a burst of building, which then steadily declined to clearly insufficient levels until the big increase in condo construction at the end of the 1990’s. The 2008 market crash ended that cycle, and the current boom in home construction has been quickly gathering steam only in the last year or so. Since 2010, San Francisco’s population has gone up by more than 40,000 and the number of employed residents has increased by over 70,000. Since only 7500 housing units have been added in that timeframe, this has put enormous pressure on the city’s housing market.
This snapshot from the interactive map on the Planning Department’s Pipeline report webpage indicates current projects in the greater South Beach/South of Market/Mission Bay district, Hayes Valley and the Market Street corridor.


