Home Appreciation 2011-2015 by Neighborhood
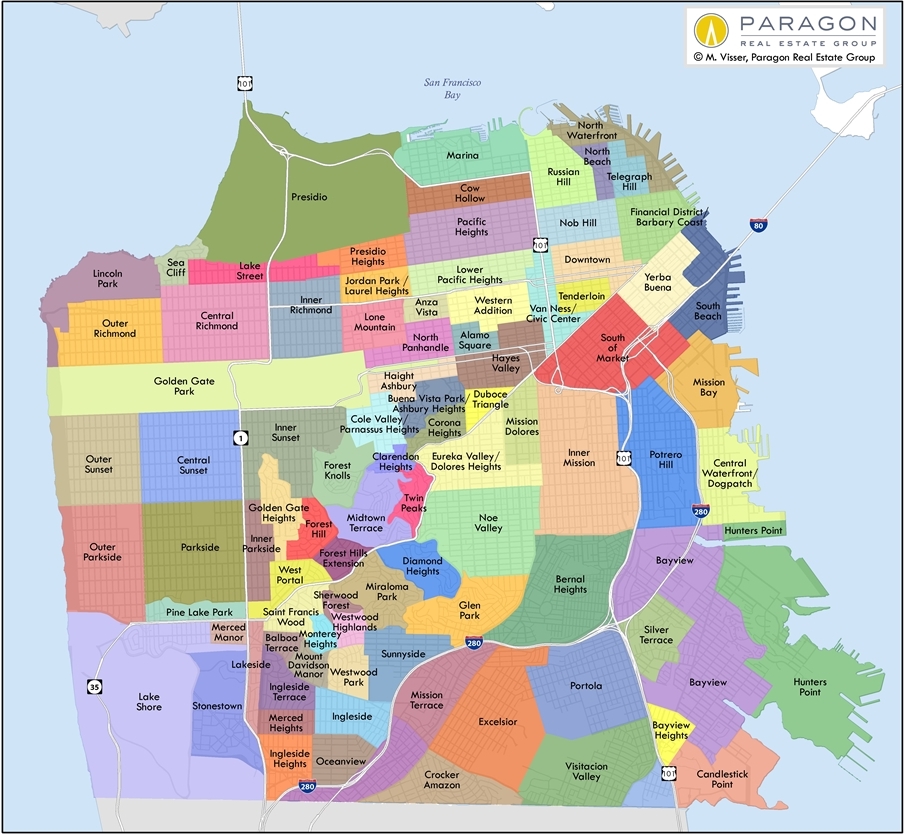
While waiting for the 2016 real estate market to really wake up and start generating useful statistical data, below is a look at San Francisco house and condo values over the past 5 years, broken out by neighborhood. In most districts, the market bottomed out in 2011, and the current market recovery began in 2012. At the bottom of this report is a map of San Francisco neighborhoods.
Important context: Median sales price is a general statistic, often concealing an enormous variety of values in the underlying individual sales. It can be and often is affected by other factors besides changes in fair market value, such as major changes in the distressed property, luxury home, or new-home construction segments. Sometimes median prices fluctuate without great significance: Substantially different groups of homes (larger, smaller, older, newer, etc.) simply sold in the periods being compared. Assessing appreciation by changes in dollar per square foot values, instead of by changes in median sales prices, can sometimes deliver significantly different appreciation rates.
San Francisco HOUSE Price Changes 2011 to 2015


San Francisco CONDO Price Changes 2011 to 2015


 -------------------------------------------------------------------------