February 2020 Market Report
This month we have a whole-Bay Area market report. This is useful to put San Francisco in context with other Bay Area communities, and particularly useful if you are considering looking outside San Francisco.
It's important to note that the Bay Area contains many different markets and market segments, sometimes following diverging trends in supply and demand, and home-price appreciation. Most of the materials in this report reflect overall trends for the entire region. When the data is available we’ve charted longer-term trends since they give much greater context to what the state of the market is today, and where it may be heading. How these statistics pertain to any particular home is unknown without a specific comparative market analysis.
Bay Area Home Price Appreciation
Median House Sales Prices, 1990-Present, 6-month Rolling Average
Year-over-Year Monthly Appreciation Rates, 1990-2019
San Francisco Bay Area % Changes in Median House Sales Prices
2019 Median House Sales Prices by Bay Area County
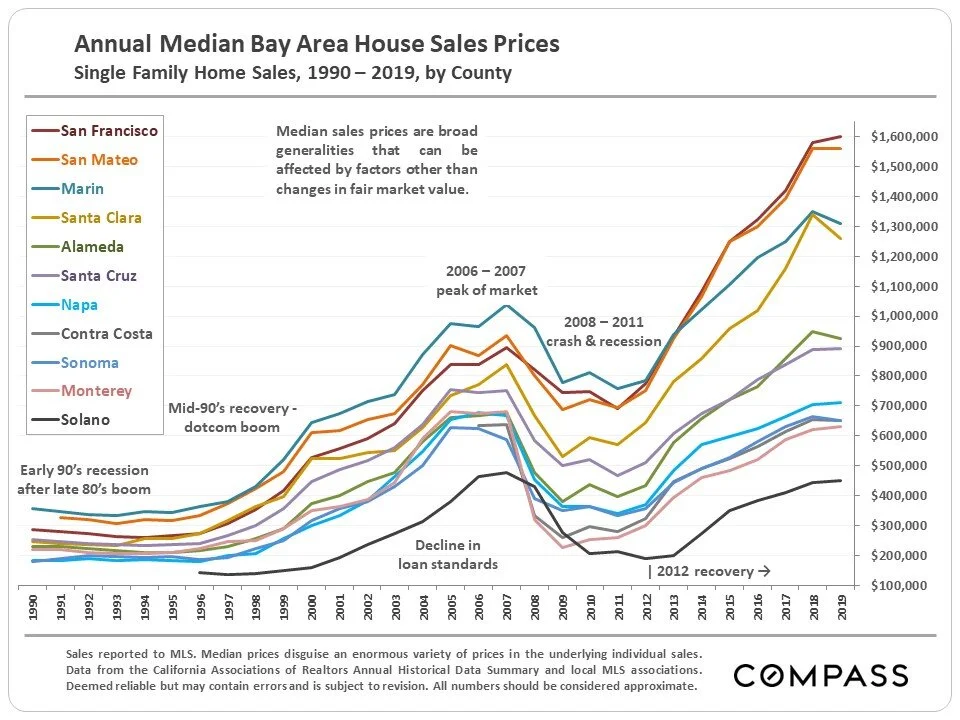
Annual Median Bay Area House Sales Prices
Single Family Home Sales, 1990-2019, by County
Condo & Co-op Sales, 1996-Present
Active, On-Market Listing Inventory Since 2013
12-Month Rolling Average
Home Sales Volumes
Bay Area Market Seasonality by Month
Days on Market
Median 12 Month Rolling Average
Bay Area Real Estate Market Since 1992
Average by County, 2019 Monthly Averages
2019 Median Quarterly Percentage of Listings Accepting Offers in Quarter
Unsold Inventory Index in Months of Supply Listings
Bay Area Real Estate Market since 1992
Percentage of Listings Reducing Price in Month
San Francisco Bay Area Real Estate Market since 2010
Bay Area High-End Home Markets
2019 Homes Selling for $2M+, by County
Quarterly Higher-Price Home Sales, $2M+, by County
Quarterly Listing Volumes since Q4 2016
Percentage of Sales Qualifying as “Ultra-Luxury” in 2019 by County
Bay Area Population Figures
San Francisco-San Jose Combined Metro Annual Population Changes
7 Counties, Census Estimates


